Performance Dashboards
Everything your team needs to monitor performance — in one view
AlertSite's dashboard gives you a real-time overview of all your monitors — status, response time, and alert state — so you always know what's happening with your applications and APIs.
Start Free Trial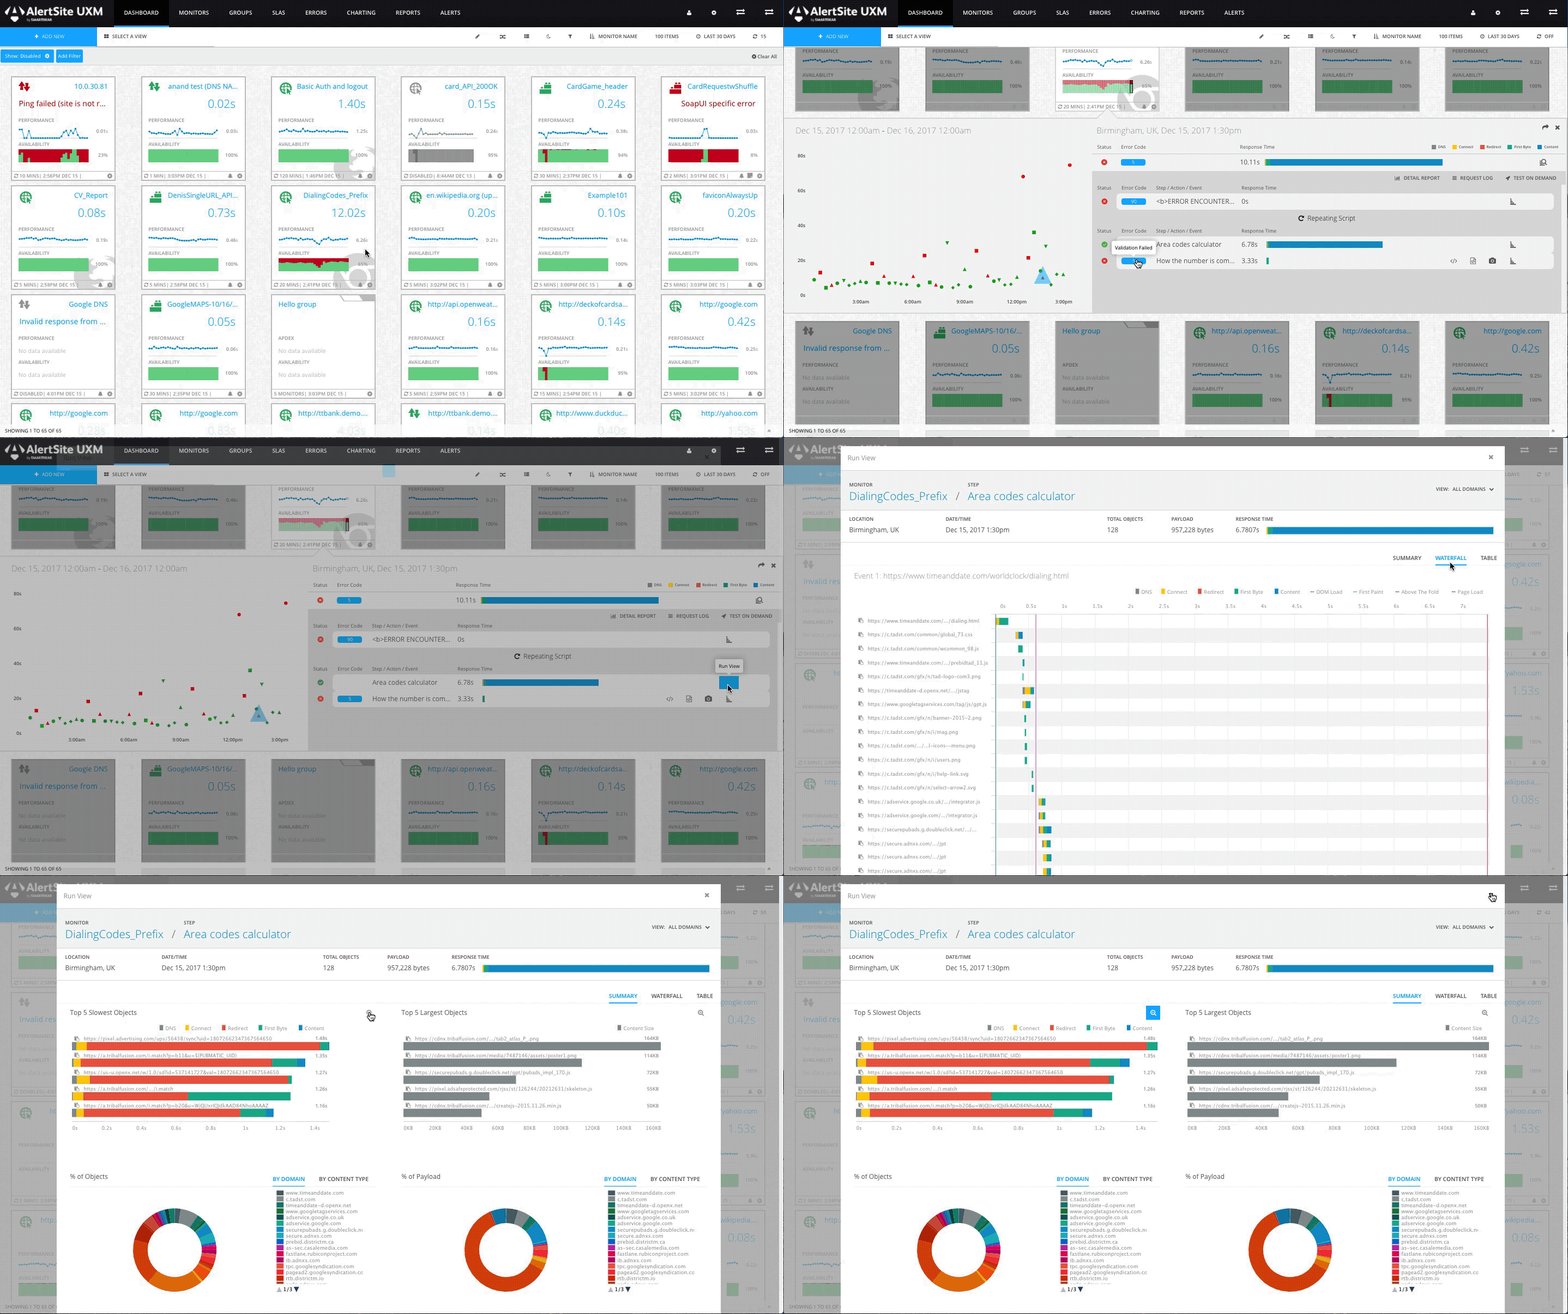
Real-time status
Monitor status across your entire estate at a glance
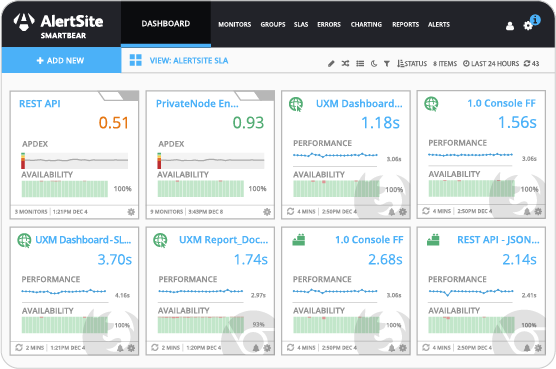
The AlertSite main dashboard shows every monitor's current status — up, down, degraded, or in maintenance — updated in real time. Color-coded status indicators make it immediately obvious which applications need attention.
Performance history
Drill into any monitor for detailed performance history
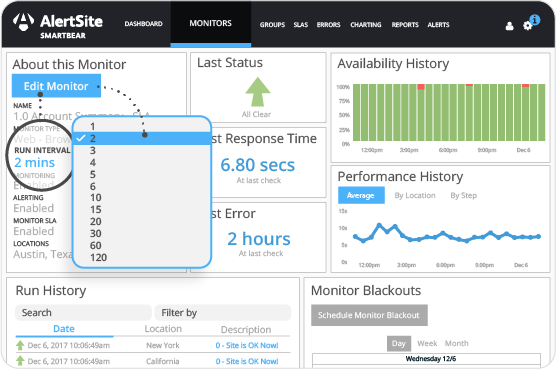
Click any monitor to see response time trends over hours, days, or weeks. Overlay incident events on the performance timeline to correlate deployments, infrastructure changes, or traffic spikes with performance degradation.
See your complete monitoring picture
AlertSite dashboards give every stakeholder the performance visibility they need.