Analyzing data and metrics from your performance monitors can be tough. Lets dive into the metrics to help make things easier: Web page load time is an important metric to determine the quality of your user’s experience. The load time depends on many things, including the network speed, server response time and content size. AlertSite measures both network timings and perceived user experience (the load speed from the user’s point of view) as the pages are loading in the browser to help you get a complete picture of end user experience.
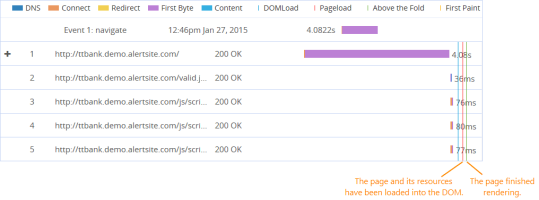
This image shows various components of the response time:

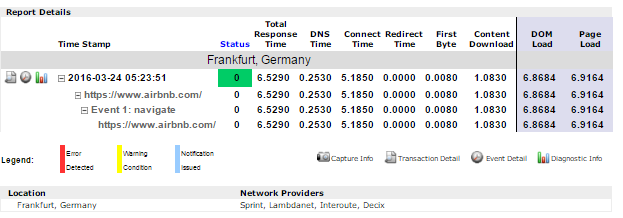
You can see these metrics for your monitors in the ‘Monitor Runs’ dashboard and in ‘reports’. Ex. This is how the response time components look like for one of our demo monitors.

You can also find details on these timings in full reports:

What do these components mean?
See How Your Performance Stacks Up With AlertSite
Response Time Components
DNS Lookup Time
Every request starts with a DNS lookup, getting the IP address for the domain name.
AlertSite UXM performs the DNS lookup using a DNS server that is local to the monitoring location and that communicates with the Internet’s DNS servers as needed. DNS lookup time increases with the distance between the DNS server and your web server, especially for international web sites. And DNS lookup time goes down significantly for cached resources.
High DNS lookup time means a problem with the DNS servers in the monitoring location. For example, the primary DNS server may be unreachable or timing out.
Note for website monitors: If you specify the IP address instead of the domain name in the monitor settings, the monitor will skip DNS lookup and this time will be 0.
Connect Time (or TCP Connect)
The time it takes to establish a connection to your web server after DNS lookup. The connection process is known as TCP handshake.
Connect time can be an estimate of the network latency between an AlertSite monitoring location and your web server. High connect times may mean network or routing problems, or that the server bandwidth is not enough to handle the workload.
After the connection has been established, the browser immediately sends the HTTP GET/POST request to the web page's URL.
Redirect Time
If a web server responds with an HTTP 301 or 302 redirect, the redirect time shows how long it takes to follow all redirects to get to the final URL. There may be several redirects, each needing another DNS lookup, TCP connection and HTTP request, so the redirect time can be represented in greater details like this:

Note: Redirect time does not apply to client-side redirects via META refresh tags or JavaScript functions.
Time to First Byte (TTFB)
Time spent waiting for the response from the server. Technically, this is the time from when an HTTP request is sent to the server (in case of redirects – a request to the final URL) to when the first byte of the response is received.
First byte time represents the server delay – how long the server needs to process the request, including database access, calculations and generating the response. High first byte time may indicate high server load, inefficient database queries, calls to busy external resources like Google or Facebook, or memory leaks.
Content Time
Time spent receiving the response data, for example, a web page’s HTML code. This time depends on the content size and the connection speed.
Note: In DéjàClick transaction monitors, if a web page contains frames (other pages), the content download time includes the base page and all of its frames. The browser loads them in parallel, so the content time is calculated from when the first content load activity begins until the last content load activity ends.
Full Page Obects Time
After downloading HTML content, the browser analyzes it and determines the referenced resources – images, JavaScript, CSS and others – that need retrieval. A separate request is then made to retrieve each of the referenced objects. Full Page Object Time is the total time spent downloading all the referenced objects. It starts when the last byte of the page’s HTML is received and ends when all page objects have been downloaded.
Often, a large part of full page objects comes from third parties such as Google, Facebook, Twitter, from ad networks like Doubleclick, or from CDNs. So this metric may be an estimate of the load time of third-party content.
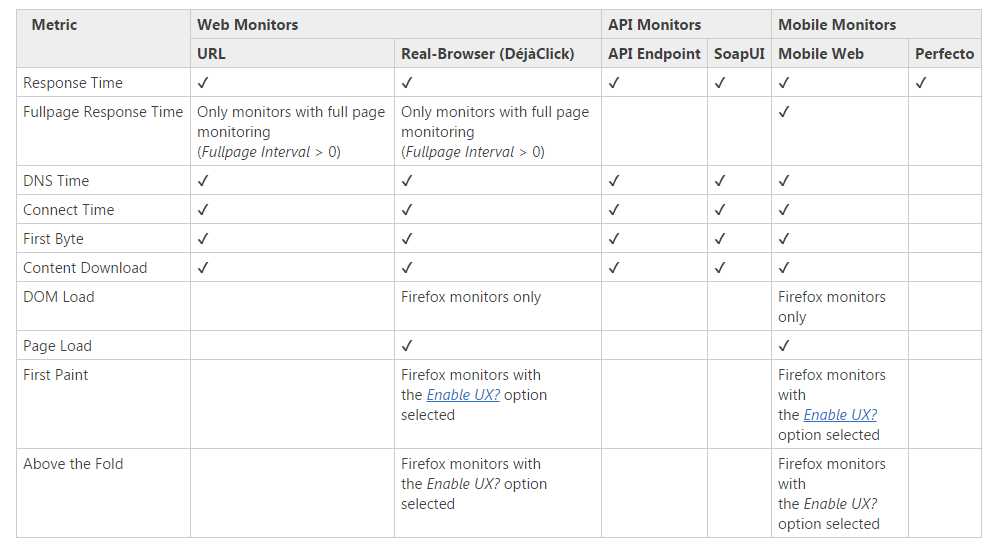
Note: This metric is available only in website, real-browser (DéjàClick) and mobile web monitors with the Fullpage Interval option enabled.
Full Page Response Time
The total time spent interacting with the web server and loading the web page and all of its linked images, JavaScript, CSS and other external files.
Note: This metric is available only in website, real-browser (DéjàClick) and mobile web monitors with the Fullpage Interval option enabled.
User Experience Metrics
Real-browser (DéjàClick) monitors collect additional metrics that reflect web page load time from the user’s point of view, such as the time when the browser starts rendering the page. These metrics help you understand what your website users are actually experiencing in real time, and not just the network activities that are happening in the background.
The browser and page rendering events appear as vertical lines on the waterfall graphs in the Monitor Runs dashboard, and also in the HTTP Step Report and Fullpage Report.

Note: There is no correlation between browser events, page-rendering events and response time components (DNS lookup, connect time and others).
Browser Metrics
These metrics are available in all real-browser (DéjàClick) and mobile web monitors:
DOM Load
The time from when a request is sent until the browser has downloaded the page’s HTML and finished constructing the Document Object Model (DOM). The timer stops when theDOMContentLoaded event is fired. Note that the referenced images, CSS, scripts and other resources may not have completed loading at this point.
Page Load
The time until the page and all referenced resources (images, CSS, scripts and others) have been fully loaded into the DOM. The page is considered fully loaded when the onload event handler is invoked.
Note: This does not include the load time of dynamic client-side content, like as Ajax or Flash applications.
DéjàClick monitors have the Show only base-page UX timing option that controls how the monitor measures the DOM Load and Page Load times for web pages that contain frames. By default, this option is enabled, so that AlertSite UXM shows the timings for just the base page, not the cumulative timings for the page and all its frames.
Page Rendering Timings
These metrics are available only in Firefox real-browser (DéjàClick) monitors with UX enabled:
First Paint
The time until the browser starts rendering the page. At this moment, the user starts seeing the page content on the screen. The first paint time depends on the HTML markup, CSS and JavaScript, but not the images.
Above the Fold
“Above the fold” is the top portion of a web page that is visible in the browser window without having to scroll down. This metric measures the time it takes for the page content above the fold to stop changing and reach the final state. If the monitor has the Fullpage interval set, this time includes the load time of referenced resources like images, CSS and others.
