Diving into what browsers and devices your website is accessed from can help you concentrate your testing on the devices and browsers that your customers are actually using. Testing on every single device can be a challenge, given the fact Android alone has over 25,000 different device combinations across 10 operating systems... a number that continues to grow. Displaying a consistent experience across platforms and devices is integral to web and software development in today's market. At CrossBrowserTesting we are obviously a little obsessed with what devices and screens our customers are using (we have over 1500 different browsers), so we use Google Analytics to measure this metric.
Mobile Device Usage in Google Analytics
Google Analytics can be a quick and free way to measure screen resolutions, devices, and the browsers your site’s visitors are often using. To see what percentage of your users are on mobile devices open up the Audience tab, and select Mobile and Overview.

On the overview page, you should see all your normal Google Analytics data segmented between Desktops, Mobile and Tablets.

In this example, about 15 percent of our traffic is from a mobile device or tablet. The usage stats for this particular account moderately favor mobile devices, which is great. We can dive in deeper to each segment to see which devices we should be testing more frequently. Not only will we see the qualitative usage of each device, but we can also pinpoint certain devices that frequently present bugs in our application.
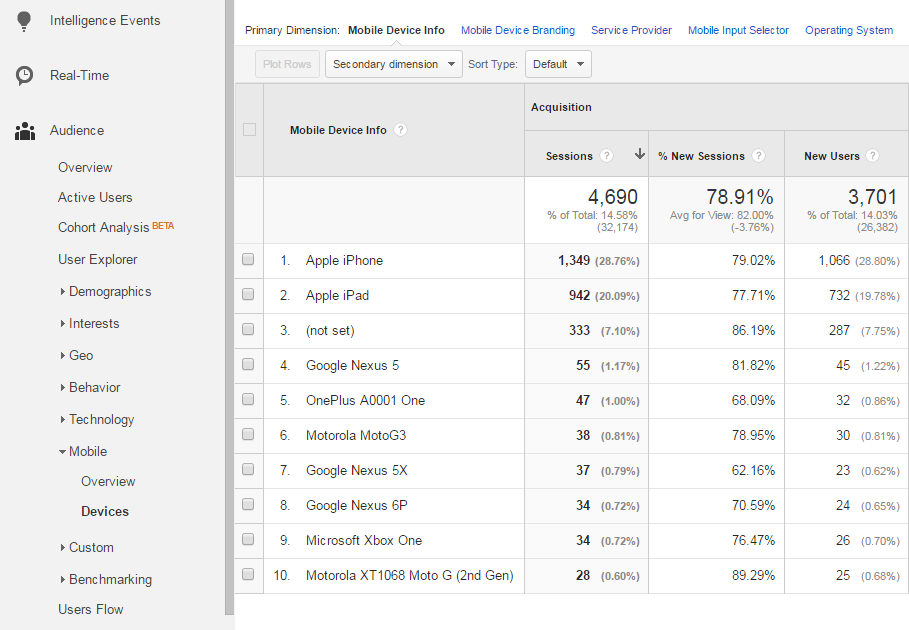
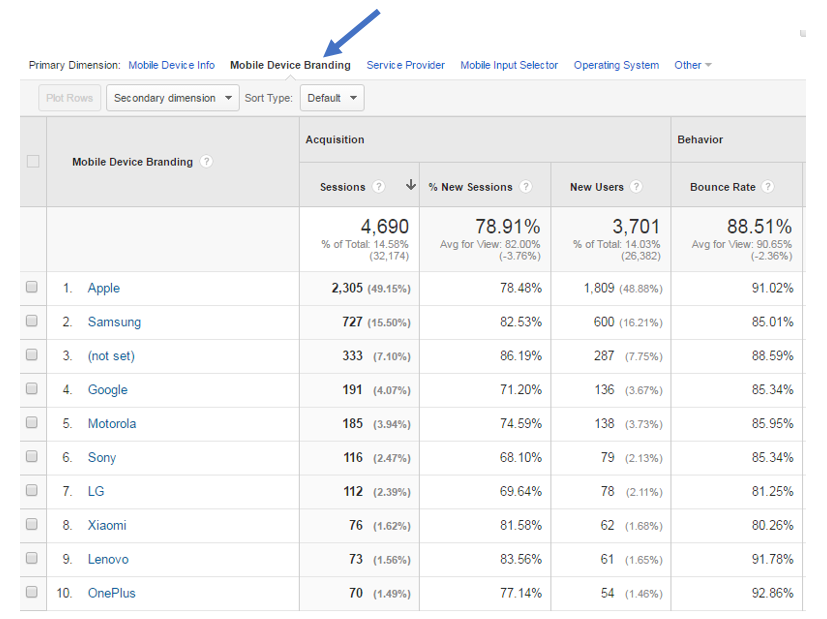
Alright, almost 50% of our mobile users are coming via Apple Devices. Notice that when you select Devices from the Mobile drop down, Google Analytics groups mobile devices and tablets together in one aggregated group. In the default view for Mobile Devices, Mobile Device Info is selected. But you can select other primary dimensions to view different data, including Service Provider, Operating system, mobile brands, and even screen resolutions.
These data points are extremely effective for improving your testing speed and coverage. Because 50% of users are using an Apple Device, it would be prudent to spend extra time with CBT’s real device Live Testing. You can run browser screenshot tests on a number of different Apple devices quickly and from one screen. You can see any media queries adjustments that may be needed from device to device or images/rich media that have become broken.
Seeing What Browsers Your Visitors Are Using
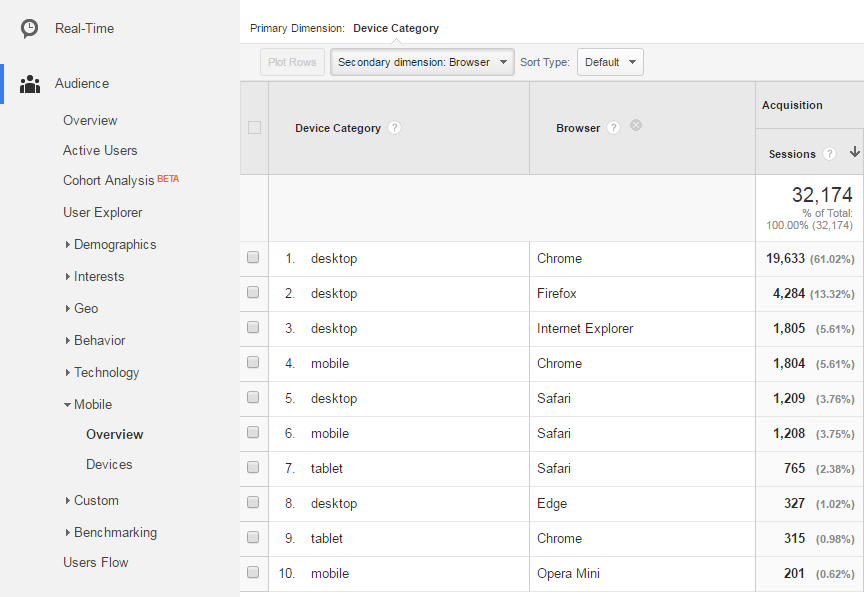
To get a broader view of all the browsers your customers are using, we can use secondary dimensions in the Mobile Overview tab. By choosing Browser as our secondary dimension we find that 61% of our visitors are coming via a desktop and using Chrome.
Let’s say you or the development team just pushed a great new home page with a slick CSS3 transition that you know will break or be a little bit off on older versions of Internet Explorer. By setting the secondary dimension to Browser, and going to advanced search, we can see how many people are using older versions of FireFox or IE and how critical they are in the testing phase.
Using a Custom Report To Scale
To speed your research and make this a truly repeatable process we’ll show you how to set up a Custom Report in GA dealing specifically with browsers and devices. In Google Analytics, head to the Customization section to add a custom report. Make the Title and Report name something relevant that you’ll remember. For report type, select Flat Table. In Dimensions, select Device Category then Browser then Browser Version. For Metrics, select Sessions.
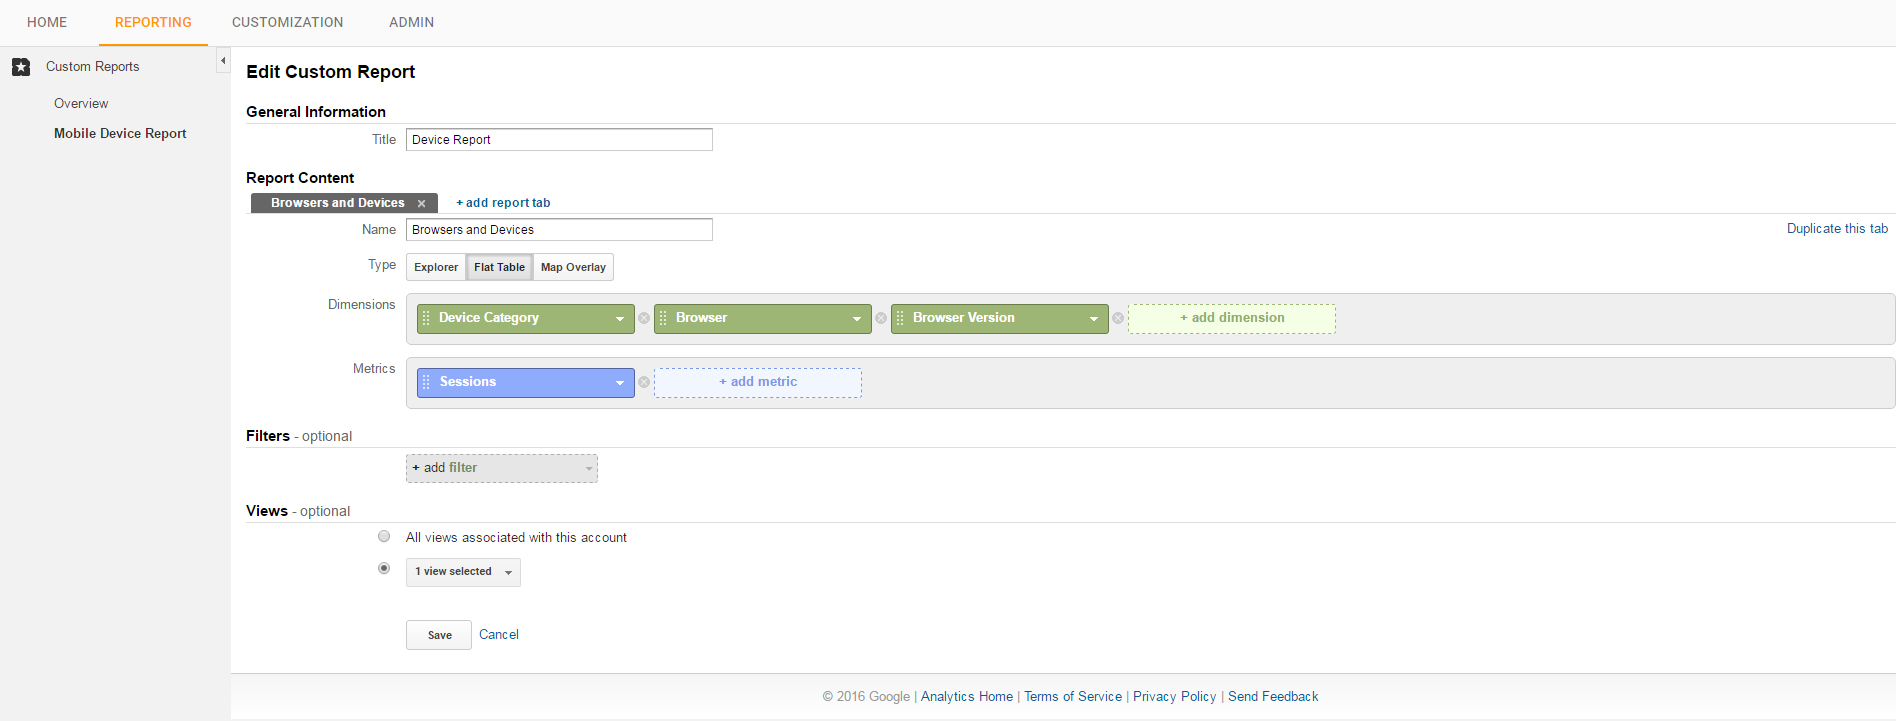
Your report should show you the most important aspects of browser testing to focus on and should look something like this:
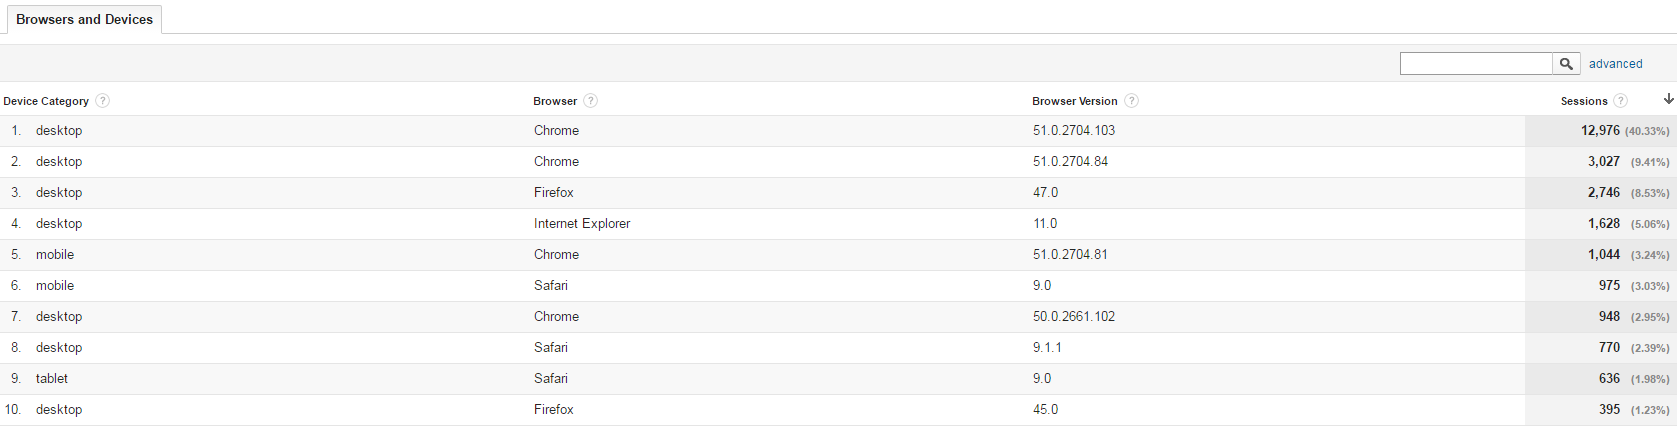
You can email this report to your Development or Test team on a Weekly or Monthly basis to consistently and effectively test the browsers your customers are actually using.
Using Google Analytics or any other analytics program to find out what browsers and devices your customers are most likely using is a huge advantage. Remember to continually check up on this report, as devices and trends are constantly changing.
For more ways to decide which browsers and devices to test, check out our guide.